OBIEE Online Training

OBIEE Online training by ex-Rittman Mead and Oracle trainer.
Contact : naveen@bipracticals.com
Watsapp : +65-82830121
Training will be real time and more hands on.
Number of slots available : 2/5

Saturday, July 28, 2012

How to deploy rpd,webcatalog and start OBIEE10G

 Follow the screenshots below:

Click on the folder OracleBI


Place your repository in the below path. Here my repository name is Test10g.


Open NQSConfig.


Include the repository name as shown in the highlighted section.Now save it.


Click OracleBIData


Place the web catalog in the below shown path.My web catalog name is Test10g.


Right click instanceconfig and open it using notepad.


Place the webcatalog path as shown below.Save it.


Type services.msc in Run.


Start all the services highlighted below.


Start OC4J now.Wait till the command prompt screen turns to initialized.


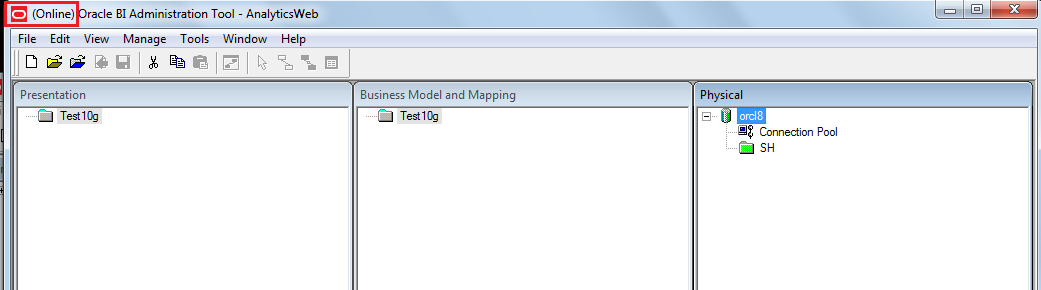
Now click on the icon shown below for opening the rpd in online mode.NOTE: Only one rpd can be opened in online mode.Online mode means that it is loaded to the BIServer.In online mode, the administrator edits a live repository that the server has in memory; that is, users can still access the repository while changes are being made. Changes to the repository are immediately applied to the server when they are checked in. Enter the username ie,Administrator and its password.


Till next time..... :)


Fixing Data Mismatch issues after upgrade from OBIEE 10g to 11g

Hey friends...i know you guys will be really struggling to fix the data mismatch issues.Unlike other issues it takes a lot of time to fix data mismatch issues.The method followed by us was a trial and error method.There are no clear cut explanation for the workarounds but it worked for us.I will be giving some tips which might help you make your bug fixing easier.

Scenario: Data Mismatch

TIP 1:

Most of the data mismatch issues can be resolved by doing the following:

Solution:Apply the aggregation rule in the report level.ie,Instead of the default aggregation given, apply aggregation rule based on the column.
eg: For the Revenue metric you can apply Sum aggregation rule instead of Default.


Reason:The default in 11g is not same as 10g.


TIP 2: 

Almost 80% of the data mismatch issues will get fixed doing this.


IMPORTANT TIP:
Solution: Try unchecking Report Based Total and checking Server Complex Aggregate in certain cases.


Reason: Server Complex aggregate will take the aggregation rule applied
in the rpd. Report based total should be unchecked on a level based measure
column to get the correct total.
If report based total is checked then it will show the aggregate
result(ie total,count…) after applying all the filters and aggregation rule).
If it is not checked then it will show the results before applying the filters
and aggregation rule (eg:there is no meaning in taking the total for a
level based measure.The total should be taken before applying aggregation
rule.hence uncheck report based total here)

For more see:
http://pagelock.blogspot.in/2012/07/report-based-total-in-obiee.html

http://pagelock.blogspot.in/2012/07/aggregation-rules-and-functions.html

NOTE1:In 11g we can apply Report based total for each column in the
report whereas in 10g we can apply it only for the complete report.

NOTE2:While migrating 10 to 11g ,report based total and default is
checked for all columns in the report level if any of the view was using
the report based total.

EXPLANATION:


Report-based Aggregate
When using report-based aggregates, you might obtain different results in 10g and 11g. You might see the different results in 11g when the following are true:
  • When a column has an aggregation rule of "Server Complex Aggregate".
  • When a pivot table includes sub-totals, grand totals, or other columns in the Excluded columns section.
  • When a column has Report-based Total (when applicable) checked.
The difference occurs because the data for this column for sub-totals was produced, for example, by the aggregate() function in 10g. In 11g, this issue is resolved by using the report_aggregate() function to accurately reflect the Report-based Total (when applicable) setting.

TIP 3:

Possible cause: Basically now all aggregation needs to be applied at criteria level and not at report level.Because in 11g what is set in criteria is not overridden even though we change it in report level.
Solution: Apply aggregation in criteria.


TIP4:


IMPORTANT TIP:
Check whether any column is hidden in criteria.This may be causing a data mismatch. Unhide that column in criteria.


 EXPLANATION:

Hidden but included data is not displayed
In 10g, if a column is hidden but included in a pivot table, the data is displayed in the pivot table. In 11g, if the column is hidden at the criteria level, then the data is not displayed.


TIP 5:

Scenario: Number of rows is less in 11g compared to 10g

Possible cause: In 11g when we apply filter on a hidden column it will be filtered but in 10g it won't be filtered if that column is hidden.
Solution: 11g is correct.


TIP 6:

Scenario : Decimal places mismatch or very slight mismatch.

Possible cause: (integer value) divided by (integer value) will give an integer value.

Solution: Convert the integer value to float and then divide.
Cast( “int x” as float) / “int y” = “float z”

In some cases rounding will work out. 


Integer division returns integer in 11g
Integer division that returns double point data in 10g returns an integer in 11g. You might notice these return values for a column in the following cases:
  • The results of the analysis lose the decimal points.
  • Data order is slightly different for the column. Because data is sorted without decimal points, some rows might contain the same values.
  • Formatting of the column is changed because the default formatting for integer (if configured) is used. (In 10g, the default format is used for double data types.)
To force integer division to return double point results, cast the numerator to a double point data type before the division. For example:
“int x” / “int y” = “int z”
Cast( “int x” as float) / “int y” = “float z”
Cast( “int x” as double) / “int y” = “double z”
If this is different behavior than you saw in 10g, then it is because a known issue caused integer division to incorrectly produce a double point result when certain physical data sources where used.


TIP 7:

Scenario: Decimal places missing.

Solution: Set decimal places to the desired value.


EXPLANATION:

Integer data types now double data types
You can override the default data format for columns that were integer data types in 10g, and are now double data types in 11g. Without this workaround, the data for this column displays as a decimal number with two digits to the right of the decimal point.
You might notice this change for a column in the following cases:
  • The results of the analysis show decimal points where integers were shown in 10g.
  • Formatting of this column is changed because the default formatting for double (if configured) is used in 11g.
You can using the following options to maintain the same result as 10g:
  • Use the Cast function to cast the values to the appropriate data type in the metadata repository.
  • Change the formatting for the column to display only integers and save that specification as the default format.

Above mentioned tips will help you in fixing 90% of the data mismatch issues.If you are not able to resolve the issues even after trying out the above methods then feel free to post the issues here so that i can help you out.

I will be discussing other issues in another post. Please let me know whether this post was helpful by putting in your valuable comments. I will be posting further based on this feedback.

Till next time .... :)


Friday, July 27, 2012

Report Based Total in OBIEE


In this scenario column "Amount Sold by Region" is a level based measure.In the column "Amount Sold by Region", amount sold is calculated at the region level.In the below figure even though the country name is changing, the region is Europe(constant) and hence Europe will have the same "Amount Sold by Region" for different country names.

With a lowest query grain, each query that requests these column will return the amount aggregated to its associated levels (in our case by region)


To obtain the good total, you have to uncheck the aggregate option : Report-Based Total (when applicable)


How Will Report-Based Totals Created in Previous Releases Be Upgraded?

In previous releases, you had the ability to create report-based totals in table views.
Because report-based totals are handled slightly differently in this release, you might
notice a difference in totals as follows:

*      If the previous table included all report-based totals, then all measure columns
and attribute columns in the upgraded table will use the Default option with the
Report-Based Total option.
   
*   If the previous table view included a mix of report-based totals and
non-report-based totals, then all measure columns and attribute columns in the
upgraded table will use the Default option with the Report-Based Total option.

      You can work around the upgraded totals manually. If you want to use the
same measure value as in the previous release, then duplicate the measure column
in the table and use the Aggregation Rule menu to specify a non-report-based total.
   
 *   If the previous table view included all non-report-based totals, then all
measure columns and attribute columns in the upgraded table will continue to use
non-report-based totals.

Aggregation Rules and Functions

The following list describes the aggregation rules that are available for measure columns in the "Layout pane" and for columns in the "Edit Column Formula dialog: Column Formula tab". The list also includes functions that you can use when creating a calculated item.

Default — Applies the default aggregation rule as in the Oracle BI repository or by the original author of the analysis. Not available for calculated items.
Server Determined — Applies the aggregation rule that is determined by the Oracle BI Server (such as the rule that is defined in the Oracle BI repository). The aggregation is performed within Presentation Services for simple rules such as Sum, Min, and Max. Not available for measure columns in the Layout pane or for calculated items.
Sum — Calculates the sum obtained by adding up all values in the result set. Use this for items that have numeric values.
Min — Calculates the minimum value (lowest numeric value) of the rows in the result set. Use this for items that have numeric values.
Max — Calculates the maximum value (highest numeric value) of the rows in the result set. Use this for items that have numeric values.
Average — Calculates the average (mean) value of an item in the result set. Use this for items that have numeric values. Averages on tables and pivot tables are rounded to the nearest whole number.
First — In the result set, selects the first occurrence of the item for measures. For calculated items, selects the first member according to the display in the Selected list. Not available in the Edit Column Formula dialog.
Last — In the result set, selects the last occurrence of the item. For calculated items, selects the last member according to the display in the Selected list. Not available in the Edit Column Formula dialog.
Count — Calculates the number of rows in the result set that have a nonnull value for the item. The item is typically a column name, in which case the number of rows with nonnull values for that column are returned.
Count Distinct — Adds distinct processing to the Count function, which means that each distinct occurrence of the item is counted only once.
None — Applies no aggregation. Not available for calculated items.
Server Complex Aggregate — Applies the aggregation rule that is determined by the Oracle BI Server (such as the rule that is defined in the Oracle BI repository). The aggregation is performed by the Oracle BI Server, rather than within Presentation Services. Not available for calculated items.
Report-Based Total (when applicable) — If not selected, specifies that the Oracle BI Server should calculate the total based on the entire result set, before applying any filters to the measures. Not available in the Edit Column Formula dialog or for calculated items. Only available for attribute columns.

Some Examples:


Tuesday, July 24, 2012

Updating Physical Layer Tables

Scenario: New columns are added to a table in the database. We want to add these columns to the physical layer table.
 

Possible ways:

1.Drop the previously imported table and re import it again. But this method won't work out when we have already defined joins and built the rpd ,because we will have to define all the joins again if we follow this method.

2.The suggested method is to use the "Update Physical Layer" Utility.Follow the steps below:


Till next time :)

Thursday, July 19, 2012

ODBC Vs OCI

Differences between ODBC and OCI


ODBC:- Open DataBase Connectivity, which is known as Universal Data Connector.
OCI:- Oracle Call Interface,Normally connects to Oracle Source.
Hence, both can connect to Oracle Sources.
ODBC :- if we are using ODBC to connect Oracle source then we need to give ODBC connection in the machine where the BI Server installed on.
-- so, the machine which have BI Server that should contain ODBC connection.
OCI:-
OCI is a Native Connection, with out having ODBC Connection in the machine we can import the data.
Ex:- Importing through Server.

OCI is a much better choice than ODBC for the following reasons:


* OCI is optimized for queries. Transparent prefetch buffers reduce round-trips and improve performance and scalability. As a result, there is reduced memory usage on the server.
* OCI is optimized for round-trips. No-reply requests are batched until the next call is generated for the server. This allows certain calls to be lazily propagated.
* OCI is thread safe. You do not need to mutex (use mutual exclusivity locks) any of the OCI handles. ODBC is not thread safe, so you have to mutex most data structures.
* OCI provides an asynchronous event notification API for active databases.
* OCI provides enhanced array data manipulation language (DML) operations that reduce round-trips.
* OCI returns ROWIDs for all rows selected for update in a single round-trip. Using ROWID allows for more efficient SQL access.
* ODBC has no concept of sessions. OCI decouples connections, sessions and transactions. Multiple users can use a single connection; they get serialized on the connection for SQL operations. Multiple transactions can exist per user. This allows users to scale and service more users than there are connections available. Sessions and transactions can be migrated between connections to the same server.
* ODBC does not support object types, large objects (LOBs), and other new Oracle datatypes.
* ODBC affects server scalability. Using ODBC and having n number of concurrent users forces the server to have n number of processes service the clients if Oracle8i is operating in dedicated server mode. Your operating system may or may not support so many connections and processes.
* ODBC is a wrapper around OCI so it is slower. 


Wednesday, July 18, 2012

Setting up the ODBC Connection for OBIEE

Follow the steps below to set up the ODBC Connection.

1.The tool is found here:


2. Load odbcad32 and you’ll get this:


3. Select “Add…” and select the Oracle BI Server and click Finish.


Till next time ...bye :)

Tuesday, July 10, 2012

BIG DATA


Due to decreases in the costs of storage and compute power, more and more companies are looking to include non-traditional and less structured - yet potentially very valuable - data (or "Big Data" as it's known) with traditional data for analysis.
Oracle offers the broadest and most integrated portfolio of products to help you acquire and organize these diverse data sources and analyze them alongside your existing data to find new insights and capitalize on hidden relationships.

 Read more here:

http://www.oracle.com/technetwork/topics/bigdata/whatsnew/index.html?origref=http://www.oracle.com/technetwork/database/options/spatial/downloads/partners/spatial-partners-data-087203.html


Exalytics "Summary Advisor" Demonstration

Watch this interesting video which demonstrates Tuning on-the-fly with the Exalytics "Summary Advisor".


Sunday, July 8, 2012

OBIEE Development Life cycle- Administration

Hi Guys,

This is a topic that everyone is already aware. While going through the oracle documentation for OBIEE Administration, I found this well explained Article. This illustrates the process involved in a development project and depicts clearly the role of various technical personals involved.


https://blogger.googleusercontent.com/img/b/R29vZ2xl/AVvXsEhFVyfQUsXxhHSKFl2uqucdAyWAdWSs5LIkFIIukZY1L2U6eNWE3M6XAkT9Omz_yeMEkAmBj52lcnFVTZxCxHCK8XQNPeGR0bXUMsSSu6PeBHiEZC0KkQNjSQU6yscf9zjUsCkicEfz4Uc/s1600/MUD.PNG


Phase II - Branching, Fixing, and Patching


https://blogger.googleusercontent.com/img/b/R29vZ2xl/AVvXsEizVlqggEZA3VXNVzfPXDequ0Ad9A329i3c1GEDt3vf4P840mBrlPLb-13Jy5fJSBos89pkpLrcuII8u2t-7q00zgMViPg6vlor5P8ylESdw2mUy07H-wuOcQfbtOkloFLho9LXVpKx-cU/s1600/MUD2.PNG


Phase III - Independent Semantic Model Development


https://blogger.googleusercontent.com/img/b/R29vZ2xl/AVvXsEiaBPM8Pg_y6kV_E5dtU8cJxEYt5KbKnSBl26VOQ0x9kzY5RzoJChSRBiRiFKPjvQ9vRXsy4-GynbAw4LBFM3_FDJImIODeHuQoTLXPct11hNaCF-9lFAn6bmrWU0uBchc6P5KSeDD4wrs/s1600/MUD3.PNG 

Find the Detailed Case Study for this example HERE

Friday, July 6, 2012

Scheduler in OBIEE11g

Hi guys..today i tried out how to schedule a report in OBIEE11g .Thought i will share the errors which i got and steps to implement the scheduler with everyone .Hope you will enjoy this post..

DIFFERENCE BETWEEN 10G AND 11G


Like OBIEE 10g we can create a saved request / Analysis in OBIEE 11g and we can schedule the reports. But in OBIEE 11g all the tables related to scheduler services are preconfigured. When we are installing OBIEE 11g, we are running repository creation utility (RCU). RCU is creating two schema called Metadata schema (MDS) and BIPLATFORM. All the scheduler related tables were created in BIPLATFORM schema. So Enterprise Manager (EM) is taking these schemas automatically and running scheduler services in BI 11g.
Connect with BIPLATFORM schema in the data source. There we can view the scheduler related tables S_NQ_JOB, S_NQ_INSTANCE, S_NQ_JOB_PARAM, S_NQ_ERR_MSG which are created already when we were running RCU.
  

Configure Email settings:


1. Login to Fusion Middleware Control Enterprise manager (http://yourservername:7001:/em) using Admin user credentials


2. Navigate to Mail tab (Business Intelligence > coreapplication > Deployment>Mail


3. Click Lock and Edit Configuration to enable changes to be made.

4. Complete the elements with the following information.


• SMTP Server – SMTP server of your email (e.g. mail.gmx.com)
• Port – Port of the SMTP server (e.g. 25)
• Display name of sender – Any name(e.g.Oracle Business Intelligence)
• Email address of sender – Sender’s email address (e.g. obiee@gmx.com
• Username – Same as the sender’s email (e.g. obiee@gmx.com)
• Password – password of your email
• Confirm password – confirm the same password as above
• Number of retries upon failure – any number
• Maximum recipients
• Addressing method To, Blind Copy Recipient (Bcc) – if you want to receive a BCC, select it.


I created a gmx mail account obiee@gmx.com by logging into www.gmx.com.I have entered the username and password of that account here.

Note: If you search a free smtp service, the site Gmx.com is reported as offered a free smtp server which work without the need to upgrade to a professional account as for instance Google and Yahoo ask for.

smtp server : mail.gmx.com
port : 25


5. Click Apply, and then click Activate Changes.


6. Return to the Business Intelligence Overview page and click Restart.


Creating an Agent to send mails:


Since we are going to configure just to test the email settings we did in the above, we create this agent as simple as possible.

Login to OBIEE Web (http://yourservername:7001/analytics)
1.Click New in the Global header and then select Agent and Actionable Intelligence


2.In the General tab set the Priority as Normal


3.In the Schedule tab and then select Once from the Frequency list box.


4. In the Delivery content tab, select the content you want to deliver clicking the Browse button.


5. In the Recipients tab, add emails (you can add external users mails as well) whom do you want to receive a mail with delivery content.


6.In the Destinations tab,select the destinations which include user dashboard and email.


7. Save the agent and Run it.You will be able to run the agent only after saving it. Click the icon shown below for running the Agent.

 
If it runs successfully recipient get the mail with pdf attachment (we selected pdf format in the Delivery content tab).


Also it appears on the corresponding dashboard of the user.


References:


Issues i faced while doing this:
ISSUE 1:


This issue is my Mozilla was updated to Mozilla10.It doesn't support Oracle BI Presentation Services.

Solution:
I downloaded and installed Google Chrome.Its working fine now.I found Google Chrome browser to be a really good browser.

ISSUE 2:


This error came when i created an agent and was trying to save it.The issue is with IE9 version.

Solution:
Works well in Google Chrome.Able to save the agents now.

ISSUE 3:


I had given 2 recipients.The report alert was being delivered only to the dashboard of the user.The report was not delivered to the mail.The issue came because i tried to send using gmail,yahoo mail etc..
Solution:
Select the SMTP server as gmx or give your company SMTP server.


Okay...guys iam going to sleep...we will deal with other OBIEE features some other day...

Till next time.. :)

Thank you

- Naveen